
You can go to the NOAA Weather Service Rivers page, then zoom in to look for a specific gauge:
Not all gauges provide predictive data, which require models built on anticipated precipitation and past precipitation impact models, integrated with upstream gauge data if available. You'll typically see a full week, including 5 days of past streamflow and gauge height, and a prediction for the next two days.
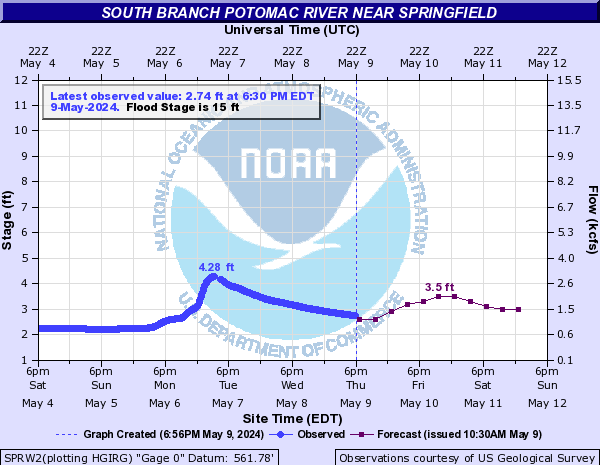
The images on these pages are dynamic, so if you visit this blog post later, you'll see the data in the image location above is changing. In order to capture an image of a flood event, you'll want to right-click the image and copy it or save it, as I've done below.


No comments:
Post a Comment